


Scale Intake Without Burning Out Your Team: Designing a Data-Driven Capacity Model
A common refrain in Infusion, and in all parts of healthcare is:
“We’re overwhelmed. We need more people.”
Referral volume rises. Therapy mix shifts. Prior authorizations become more complex. Backlogs grow. Overtime increases.
Throwing more people, or more AI automation, at the problem feels like the immediate solution.
But most organizations still cannot clearly articulate whether the strain is coming from demand, productivity, complexity, or workflow design.
Are referrals truly outpacing capacity?
Is internal effort per referral increasing?
Has payer or therapy mix shifted?
Is automation accelerating throughput while increasing exception handling?
Without a disciplined way to separate these forces, staffing decisions become reactive. Growth becomes risky. Margin compression follows quietly. Burnout accelerates.
Scaling intake responsibly requires something most practices do not yet have:
Capacity Visibility.
In operationally disciplined industries, expansion decisions are not based on how busy a team feels. They are based on throughput, available time, and constraint points. The same principle applies to infusion intake. Whether work is manual, automated, or hybrid, you must understand how much internal effort referrals require and how that compares to available staff capacity.
A data driven capacity model brings structure to that conversation. It replaces anecdotes with arithmetic. It distinguishes temporary spikes from structural deficits. And it turns hiring from a reaction into a defensible decision.
Before designing that model, we need to address a foundational issue:
Most intake operations are not instrumented to see their own effort clearly.
Most Practices Operate at One of Three Maturity Levels
Before you can align capacity to demand, you have to see what’s happening.
Level 1: Calendar Lead Time Only
Many practices track referral received dates and the date of first appointment. This tells you how long a referral took in calendar days.
It is useful for access metrics and revenue timing. But it blends together internal work and external waiting. A referral that takes five days could involve two hours of internal effort or twenty minutes. Lead time alone cannot tell you which.
Hiring decisions based solely on lead time are inherently imprecise.
Level 2: Discrete Status Tracking
More mature organizations track referrals as they move through defined intake stages. Work is no longer buried in email threads or spreadsheets. Each referral progresses through structured states that reflect where it sits in the process and what dependency is blocking it.
These stages often include activities such as:
- Prior authorization submitted
- Waiting on payer response
- Waiting on provider documentation
The exact steps vary by organization, therapy mix, and payer landscape. But at Level 2, referrals move through a visible, defined workflow.
Leaders can see:
- How many referrals are in each stage
- Where bottlenecks are forming
- Which steps are externally dependent
- How long referrals are sitting in a given state
Level 2 provides operational flow visibility and where work is sitting, but it still does not quantify internal labor effort.
Level 3: Structured Effort Visibility
At this level, each referral task captures enough metadata to drive analysis: who did the work, when they started and completed it, what pathway the referral followed, and how often exceptions occur. You do not need minute-by-minute motion capture. What you need is consistent visibility into active work vs external waiting periods. If your system logs task status changes and timestamps, you can derive reliable proxies for internal effort without making coordinators babysit timers.
Level 3 enables confident estimation of internal effort, identification of variability drivers, and fair comparability between sites.
The Technology That Enables Capacity Visibility
Capacity visibility begins with how intake is managed.
At Level 1, where you are primarily tracking referral received dates and appointment dates, a spreadsheet or two may be sufficient. If you are simply logging referrals and owners, Excel can work.
But once you move beyond basic tracking into productivity improvement and capacity planning, spreadsheets begin to fail.
At Level 2 and beyond, referrals must move through defined workflow states within a dedicated system that can:
- Assign and track ownership
- Timestamp status transitions
- Distinguish active work from external waiting
- Export structured workflow data for analysis
Many organizations operate effectively using SharePoint Lists, HIPAA-compliant low-code platforms, or configurable intake workflow systems. More sophisticated operators may build custom solutions integrated with their EHR.
The specific tool matters less than the structure it enforces.
Spreadsheets can track referrals. They cannot instrument effort.
And without structured workflow data, capacity modeling becomes speculation.
Lead Time Is Not Labor Effort
A referral that takes 10 calendar days to complete may involve only a handful of internal work activities. Most practices conflate calendar lead time with internal labor effort because that is what their existing tracking produces.
But lead time and labor effort are not the same.
For capacity planning, you must distinguish between:
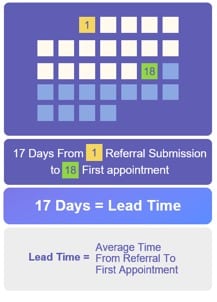
Lead Time: total elapsed time from referral received to first appointment, including time waiting on payers, providers, and patients.
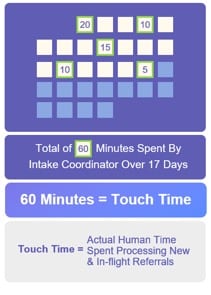
Touch Time: the internal staff effort required to move the referral forward.
Lead time tells you how long patients are waiting.
Touch time tells you how much capacity you are consuming.
Capacity planning depends on touch time.
Once you can approximate internal effort, the next question becomes straightforward:
How does that effort compare to the capacity you have available?
That is where takt time enters the conversation.
Takt Time: Aligning Effort to Capacity
Takt time is a capacity alignment metric. It answers a simple but critical question: given your current staffing and referral demand, how many internal effort minutes per referral can your system sustain without falling behind?
Formally:
Takt Time = Available Productive Minutes ÷ Required Referral Volume
This is not an industry benchmark or a theoretical ideal. It is a structural reflection of your staffing model and your demand profile.
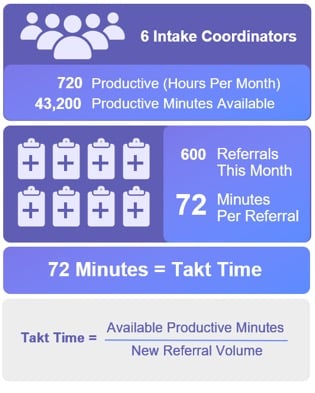
For example, imagine an intake team with 6 coordinators, each contributing 120 productive hours per month after meetings, PTO, and administrative time are accounted for. That equates to 720 productive hours, or 43,200 available minutes in a month. If the organization receives 600 referrals in that same period, the implied takt time is 72 minutes per referral.
Importantly, that 72 minutes reflects internal labor capacity only. It does not include calendar time spent waiting on payers, providers, or patients. Waiting does not consume capacity unless it triggers additional staff effort, such as follow-up, rework, or exception handling. Takt time is a constraint on internal touch time, not lead time.
The next step is to compare this constraint to your expected touch time per referral. Expected touch time is derived from structured workflow data — an estimate of the internal effort required across referral types and pathways, weighted by how frequently each occurs. It reflects what your intake team actually experiences, not a theoretical average.
When expected touch time remains below takt time, the system has a buffer. When it consistently exceeds takt time, effort accumulates. That accumulation rarely appears all at once. Instead, it surfaces gradually through growing backlog, increasing carryover work, rising overtime, and escalating cost per referral.
Hiring decisions should be grounded in sustained misalignment, not short-term pressure, and Takt time makes that imbalance visible and actionable.
Modeling Expected Touch Time
Once you have structured workflow data, modeling expected touch time becomes practical.
Start with the metrics from your intake tracker. Over a defined period, for example, the last three months, analyze the time spent in active work states and exclude time spent waiting on external parties. The focus is internal effort, not calendar duration.
Next, group referrals into a small number of meaningful segments that materially affect internal effort. You do not need dozens of categories. In most organizations, 10-20 clear segments are sufficient. Examples of referral segments could be the unique combinations of the following attributes:
- Require prior authorization
- Medical benefit vs pharmacy benefit billing
- High cost vs low cost therapies
- New vs existing patients
For each segment, calculate the average internal touch time required to complete a referral. That estimate should reflect the sum of the discrete tasks that make up the workflow, e.g., benefits investigation, authorization activity, follow-up, scheduling, and any typical exception handling, etc.
Then weight those averages by how frequently each segment occurs. The result is your expected touch time per referral, a blended estimate reflecting the actual mix of work your intake team handles.
This estimate is not just useful for monthly modeling. It also allows you to approximate total effort in flight at any point in time. By applying segment-level effort assumptions to:
- New referrals entering the system
- Referrals currently in progress
- Referrals remaining in specific workflow stages
You can estimate total internal minutes required to clear current demand. That provides real-time visibility into workload pressure, not just historical averages.
Precision is less important than consistency. If expected touch time begins to trend upward, whether due to payer mix, therapy complexity, automation gaps, or exception frequency, that shift will appear in your capacity model before backlog and burnout become visible.
Once the expected touch time is defined, it can be compared directly to takt time.
That comparison turns intuition into arithmetic and creates the clarity needed to drive disciplined productivity and hiring decisions.
Diagnose Before You Add Capacity
Because expected touch time is calculated from structured workflow data, often as a rolling average, any sustained increase can usually be traced to one of three drivers:
- Operational performance declined
- Referral mix became more complex
- Referral volume per FTE increased
Data from your intake tracker allows you to evaluate each quickly.
If volume and mix are stable but touch time increased, the issue is likely operational, training gaps, workflow drift, rework, or performance variance across staff. Start there.
If the share of referrals requiring prior authorization, medical benefit review, or higher-complexity therapies increased, the effort shift is structural. You might be starting to hit capacity constraints if you believe the referral mix shift is permanent and not temporary/seasonal.
If referrals per coordinator increased materially beyond available productive minutes, you are likely facing a true capacity constraint and should consider expanding the team.
Hiring should follow diagnosis, not precede it, meaning the objective is not to add headcount at the first sign of strain. It is to understand why effort now exceeds sustainable capacity and respond deliberately.
Scaling Intake as a Growth Discipline
Multi-site infusion organizations invest heavily in referral growth, new therapies, and automation. Intake capacity and productivity are rarely modeled with the same rigor.
Without capacity visibility, growth amplifies misalignment. Backlog expands. Overtime becomes embedded in the operating model. Margin erodes quietly.
With capacity visibility, leadership can see strain before it becomes burnout. They can quantify the effort impact of mix shifts, distinguish efficiency problems from true undercapacity, and plan staffing deliberately rather than reactively.
For organizations operating 5 to 50 locations, variability compounds quickly. Without a shared view of expected touch time and takt time, each site drifts based on anecdote. With it, capacity becomes measurable and comparable across the enterprise.
Growth is not just about adding referrals. It is about sustaining throughput without degrading economics or exhausting the team.
Capacity visibility does not eliminate hard decisions. It makes them disciplined, allowing you to scale with confidence while protecting the team that powers your growth.
`
About the Author:
Chris Hilger is the CEO of SolisRx , a boutique healthcare analytics consultancy specializing in multi-site infusion and specialty pharmacy organizations. Since launching SolisRx in 2023, the team has launched 50+ analytics and workflow automation solutions designed to accelerate performance across four core growth areas: referrals, intake operations, revenue cycle, and market expansion.
Chris holds a Master’s in Health Data Science from Harvard and was selected to present at NICA 2025 and NHIA 2026 on topics including infusion analytics, intake workflow visibility, and automation. His insights were featured in Bourne Partners’ 2025 Infusion Market Update, and he continues to work closely with operators and investors to drive sustainable growth through better data.

